Commentary
Second in a Series: Can ‘Farebox Recovery’ Recover?
Written by David Peter Alan, Contributing Editor
Running a railroad is a complex endeavor. So is running urban rail transit, such as metropolitan-style rail lines (like the New York subways), urban light rail, and modern-style or heritage-style streetcars. While almost all the major transit providers also operate bus networks of comparable magnitude, railroads and rail transit are more complex and expensive. The agencies that run them must not only operate the service, but they must also keep their infrastructure in a state of good repair. One place where they get some of the money to perform both of those tasks is from the farebox.
What does “Farebox Recovery” Tell?
Farebox recovery is a performance metric, but it does not reveal how many dollars an agency must raise from sources other than the fares riders pay, to pay the bills. Still, it does correlate with the agency’s overall financial health, and it measures the public’s willingness to ride, as well as the utility that the riders derive from the rides they take. It might say something about elasticities of demand for transit, just as the amount of service that is provided might say something about elasticities of supply for transit, but that level of economic analysis lies far beyond the purview of this series.
Still, a rigorous analysis of farebox recovery is not required. Simply stated, a farebox recovery decline indicates that a transit agency is not getting as much money directly from riders as it had gotten in the past. Inflation has been high since the COVID-19 virus struck, which means that the costs of providing transit have risen, too. That money must come from somewhere; if not from the riders, it must come from other sources. For the most part, that means grants from the federal, state or local governments.
Federal grants for capital projects, which have existed for almost 60 years, will continue. As we showed in the previous article in this series, federal funds for operating support have come and gone, mostly gone since 1998. There has been an infusion of $69.5 billion federal dollars since the virus hit, but that was a one-shot effort to keep transit going when ridership generally and commuting especially, at least with workers going into the office five days a week, sank to their lowest levels in memory.
It wasn’t only the lack of commuters that reduced the transit agencies’ incomes. Health officials told everybody to “shelter in place” and not to go out unless it was absolutely necessary. There were “essential workers” who had no choice, and their ranks contributed many of the riders who were still on the trains and other transit during the worst of the pandemic. Reports of dubious credibility condemned “mass transit” as being a breeding ground for the virus. Transit’s very reputation was damaged.
Today, service has returned to pre-COVID levels, or nearly so. Ridership has not, though, and costs keep rising. On Sept. 23, 2022, Garrett Shrode wrote in an article headlined The Mass Transit Fiscal Cliff: Estimating the Size and Scope of the Problem for the Eno Transportation Center: “As stay at home orders were put into place in 42 states and the District of Columbia in March of 2020, ridership plummeted as those who were not deemed essential were mandated to stay at home. Even those going out for essential work and essential trips usually opted for more individualized forms of transportation, such as a personal automobile or bicycle, to reduce their contact with others. Transit agencies’ fare revenue dried up overnight along with their ridership, leaving unsustainable gaps in their annual operating budgets. Industry wide, mass transit fare revenue in the United States dropped from a total of $15.8 billion in 2019 to $8.7 billion for all of 2020.”
That means that farebox revenue for 2020 was only 55% of the 2019 total, even though the COVID emergency did not go into effect until March 16 of that year, the 75th day of the year. That meant revenue stayed “normal” for the first 20% of 2020.
A Look at Farebox Recoveries Generally
Almost all transit agencies that provide rail transit or trains are major systems, especially the legacy systems that have operated such diverse modes for decades. The situation appears worse for the large providers than for the smaller ones, as Shrode reported: “Agencies with higher fare reliance faced greater budget gaps. But state and local operating assistance decreased as well, across all agencies by 12% and 16% respectively, as local and state budgets similarly took a hit. Meanwhile, agencies still provided essential transportation services (including extra cleaning) and their overall operating expenses declined just 1% from 2019 to 2020.”
According to Shrode, the COVID relief legislation gave less money to the large agencies that have rail components and more to the smaller providers: “The Coronavirus Aid, Relief, and Economic Security (CARES) Act (March 2020) provided $25 billion in emergency funding for transit agencies, all of which could be used for either capital or operating expenses. Because the bill was penned and passed in a great hurry, amidst the early pandemic confusion, the distribution formula for transit funds was not heavily scrutinized, resulting in a disproportionate distribution with no regard to operating costs or farebox revenues. For example, the CARES Act gave the New York MTA aid equivalent to 34% of its 2018 operating expenses, and San Francisco Muni only 23% of a year’s OpEx, but the average for the smaller providers (outside the top 20 highest fare totals) was that their CARES grants were 72% of one year’s operating expenses.”
The Coronavirus Response and Relief Supplemental Appropriations (CRSSA) Act (December, 2020) and the American Rescue Plan Act (March, 2021) added more money to the pot, but did not eliminate the imbalance that favored the smaller agencies, even though both reduced it by tying grants to agencies’ 2018 operating expenses.
Shrode reported that, overall: “In total, the three federal relief laws supplied almost $70 billion of funds for public transit operations in the United States (For context, the IIJA [Infrastructure Improvement and Jobs Act, also known as the Bipartisan Infrastructure Law (BIL)] provides $18.2 billion annually to transit agencies for capital projects only, except in urbanized areas under 200,000 population). The federal relief funding has provided critical support to transit service throughout the pandemic, but these funds will not last forever and are not necessarily targeted to the agencies that have the largest revenue gaps. On many services, transit ridership, and thus fare revenues, might not fully recover by 2030. As agencies publicize their FY23 budgets, some are predicting large operating budget shortfalls as their COVID aid runs out.” So far, Shrode’s prediction seems to be accurate.
Farebox Recoveries Analyzed
At the beginning of his analysis of revenue risk by mode, Shrode said, “Some modes of transit are more reliant on fare revenues than others. Eno analysis shows that the most fare reliant modes are high-capacity modes that, pre-pandemic, heavily served commuters, including commuter rail, commuter bus and heavy rail.” Of the rail modes, heavy rail had the highest recovery, at 50% on average, but 70% on the New York subways. Commuter rail came in at 50% nationally and 55% for New York MTA’s railroads, Metro-North and the Long Island Rail Road. The MTA’s service area does not have streetcars or light rail. The former brought in 31% and the latter 22%, all according to 2019 pre-COVID numbers.
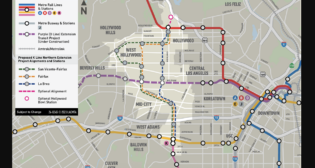
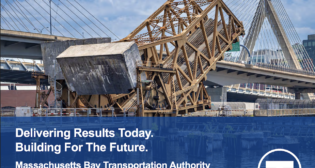
The farebox recovery ratios provided in Shrode’s report yielded a mixed bag, with some providers accomplishing strong ratios, while others had extremely weak ones. Looking at the major systems that we plan to consider in this series, rail providers showed significantly higher farebox recovery than systems that operated both bus and rail services, implying that a large bus presence reduced farebox recovery. For the rail-only providers, Caltrain had a 73% farebox ratio in 2019, BART 72%. Metro-North had 60%, LIRR 51%. PATCO (between Philadelphia and South Jersey) had 47%, PATH (between Manhattan and North Jersey) 45%, Northern Indiana Commuter Transportation District 43%. Operations with a rail component generally had lower farebox recoveries before COVID hit, although MTA New York City Transit, with its subways and buses, yielded 53%. Others were the MBTA, 45%; New Jersey Transit, 43%; Chicago Transit Authority (CTA), 41%; SEPTA, 35%; WMATA, 33%, MARTA (Atlanta), 27%; Denver RTD 24%; San Francisco Muni 23%; and LACMTA (Los Angeles) only 15%.
That was before the virus struck, and farebox recoveries have dropped, plummeted in some places, since that time. Commuting has not returned to pre-COVID levels, while many office workers have switched to a “hybrid” schedule where they go into the office on some days, while other former office workers never or hardly ever have to do so. As the new work patterns are affecting commercial real estate significantly in the downtown areas of the nation’s largest cities, they are affecting transit, too. Ridership patterns have changed in some places, including NJ Transit, where weekend trains are often more crowded than traditional weekday rush hour trains into and out of New York City. Many of the remaining commuters fill the trains on Tuesdays, Wednesdays and Thursdays to a much greater extent than on Mondays and Fridays, but NJT schedules do not reflect that change yet, most likely because all NJT trains into and out of New York City operate over Amtrak’s Northeast Corridor, and schedules are extremely difficult, if not impossible, to adjust. It’s far easier to own than rent, which Amtrak knows all too well.
Looking Toward the Future
Shrode concluded his report by saying: “When each agency hits the fiscal cliff, and how they deal with it, depends greatly on their situation. Agencies with large budgets, those that rely on fares for a significant portion of their operating revenues, and those with commuter bus, commuter rail and heavy rail services are most at risk. A federal solution to provide additional operating funds to the few dozen agencies that need it will be politically difficult in Congress. Finding large sums at the state and local level will be challenging for many regions. Making service cuts will be painful to riders who rely on transit.” The situation has not changed much during the nearly 18 months since that report was issued.
Beyond Shrode’s analysis, it appears that providers at both ends of the continuum face either one huge problem or a different one. For the highly fare-reliant rail systems, exemplified by Caltrain and BART in the Bay Area, many of the former commuters are working remotely from home, and the providers need to reinvent themselves as offering useful transportation throughout the day to the residents of their catchment areas. For the providers who operate large bus systems in addition to their rail components, the challenge is to convince the residents of their service areas that they are relevant and can offer the sort of useful transportation at all reasonable times to satisfy the needs of the communities they serve, at least enough to convince their constituents to come back to transit and keep riding.
However strong or weak any national trends concerning transit might be, the transit industry still serves local transportation needs. Decision-making remains a local function, subject to federal grants for capital projects. Different providers of rail transit around the country are dealing differently with the impending fiscal cliff, and some are doing better than others. It appears that one of the most successful is the New York MTA, the nation’s largest provider by far. We will check on that agency in the next article in this series.

David Peter Alan is one of North America’s most experienced transit users and advocates, having ridden every rail transit line in the U.S., and most Canadian systems. He has also ridden the entire Amtrak and VIA Rail network. His advocacy on the national scene focuses on the Rail Users’ Network (RUN), where he has been a Board member since 2005. Locally in New Jersey, he served as Chair of the Lackawanna Coalition for 21 years and remains a member. He is also a member of NJ Transit’s Senior Citizens and Disabled Residents Transportation Advisory Committee (SCDRTAC). When not writing or traveling, he practices law in the fields of Intellectual Property (Patents, Trademarks and Copyright) and business law. Opinions expressed here are his own.