Commentary
Alternative Energy Efficiency: ‘Does it Pencil?’
Written by Michael Iden, P.E., Contributing Editor and Consultant, Tier 5 Locomotive LLC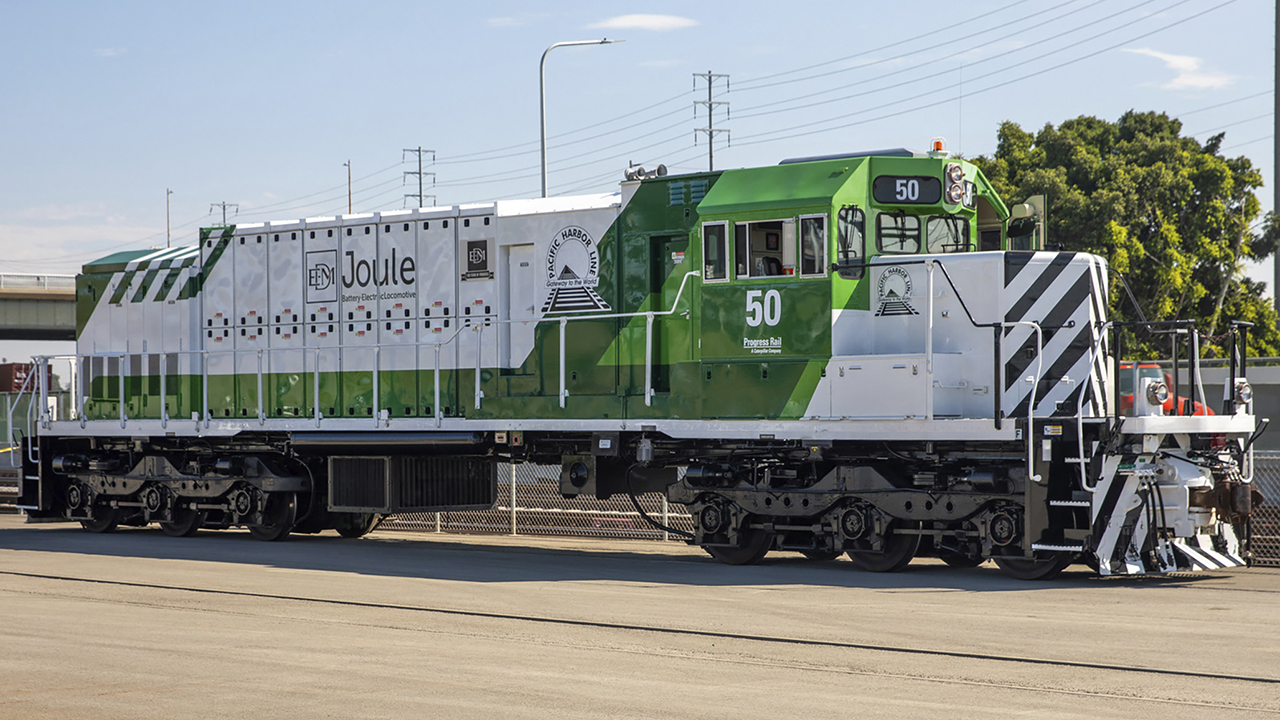
Progress Rail
RAILWAY AGE, SEPTEMBER 2024 ISSUE: The question “Does it pencil?” is a term used by real estate investors when analyzing a building or property project from a financial perspective. Quoting from a recent New York Times article: “A project that pencils is one that makes financial sense … When developers say something pencils, they are saying that whatever they want to build has a chance of making enough money to overcome the many chances of failure.”
I’m going to borrow this real estate phrase and apply it to assessing the energy efficiencies of various alternative locomotive propulsion ideas swirling around the railroad industry. We will discover that different proposals will have different energy efficiencies. My question for you, as you consider alternative proposals for railroad propulsion, is: “Does your alternative propulsion and/or energy idea pencil?” In other words, does it make sense from an energy efficiency perspective?
And, when you evaluate a rail propulsion concept, you must make similar evaluations for at least one other alternative. Your job as a manager is to make or recommend decisions based on honest data converted into rational information. Many future propulsion and energy technologies have a “silver bullet” aura or glow. In case you’ve never heard the phrase “silver bullet,” it’s a metaphor, for quickly choosing one singular solution to solve a massive and complex “problem.” You must pencil all alternatives, without exception.
What is energy? From the U.S. Energy Information Agency: “Scientists define energy as the ability to do work. Modern civilization is possible because people have learned how to change energy from one form to another and then use it to do work.” Locomotives use energy to move freight (or people).
Any process or thing that uses energy will always end up wasting some amount of it, because no energy conversion process is 100% efficient. Every process that converts energy from one form to another (for example, from chemical energy in a fuel into mechanical energy from the engine) ends up wasting some amount of the input energy, typically as heat, friction, noise, etc. Thus, energy efficiency defines how much is converted into work
How efficient is the U.S. in using energy? The average reader may be shocked to learn that, as a nation, we effectively use only one-third of all the energy we consume. The other two-thirds is lost or rejected energy in the form of waste heat, friction, noise, etc.
Every year, the U.S. Department of Energy Lawrence Livermore National Laboratory publishes a U.S. Energy Consumption flow chart (technically known as a Sankey Diagram showing where our energy comes from and where it all goes). The 2022 diagram released in late 2023 is shown in Figure 1. The unit of measure for energy on this chart is the quad, which means one quadrillion BTUs of energy. I won’t bore or confuse you with conversion factors; 100.3 quads is a lot of energy.
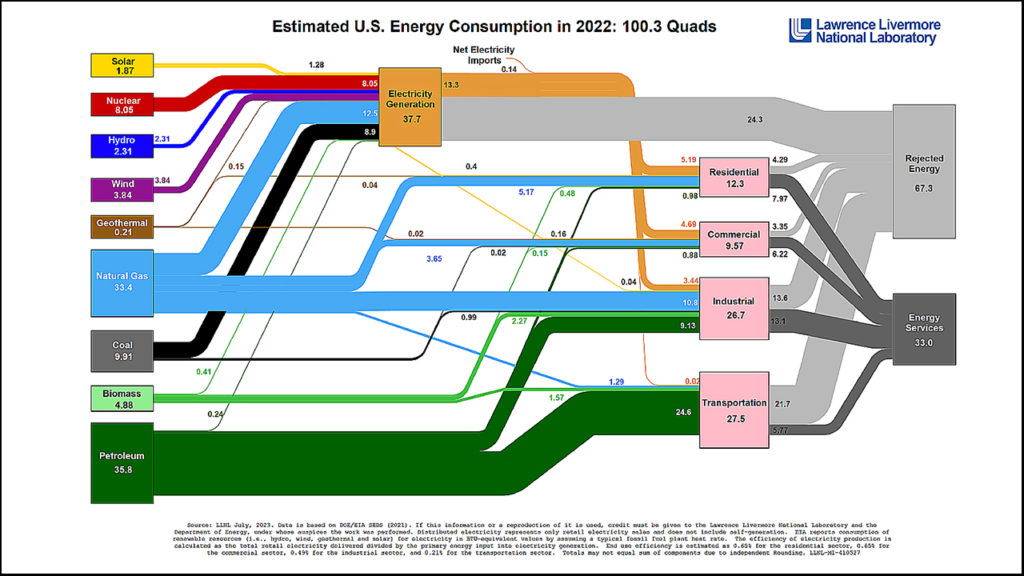
Note that transportation (cars, trucks, trains, planes, boats, etc.) is the second-largest use of our energy. Transportation in 2022 wasted 79% of the energy used (21.7 quads rejected/27.5 quads used = 0.79 or 79%). In fact, transportation wasted a greater percentage of energy used than electric generation (24.3 quads rejected/37.7 quads used = 0.64 or 64%), largely because of the relative inefficiency of gasoline-powered automobiles.
Energy efficiency for any system (a locomotive, your automobile, a washing machine) is calculated as follows: Work Performed (energy out)/Energy Input (energy in) X 100% = Energy Efficiency Percent.
Why is it so important to pencil or run the numbers on energy efficiency? Because every alternative propulsion scheme has different conversion efficiencies involved in converting energy. Deciding on only one alternative is a blind selection.
The AC Locomotive
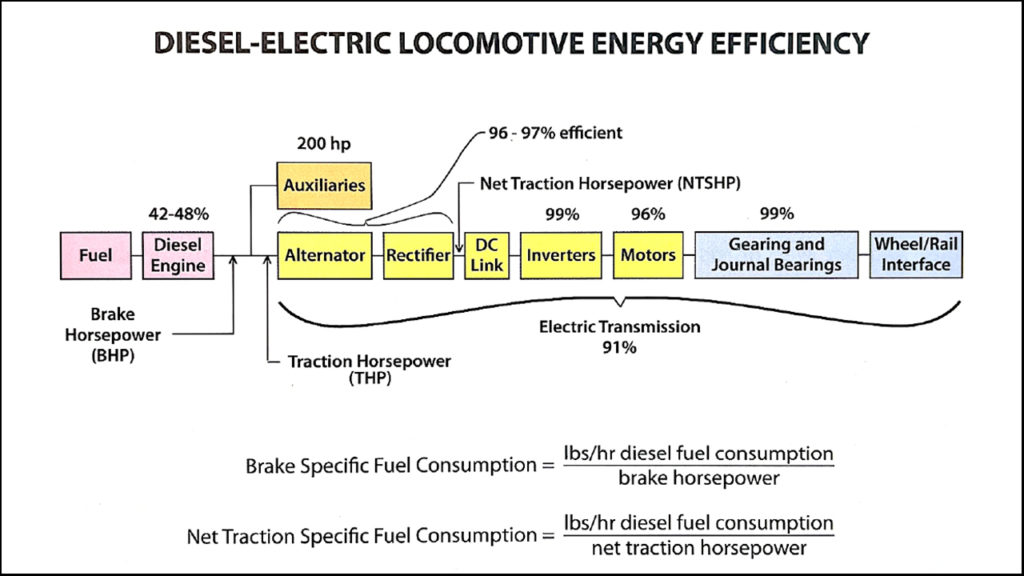
Figure 2 is a diagram from page 97 in the late Walter Simpson’s book Diesel-Electric Locomotives, published by Simmons-Boardman. This book provides clear and simple explanations of everything diesel-electric (much of which also applies to battery-electric, hydrogen fuel cell and even conventional all-electric locomotives). This shows the energy chain on board an AC diesel-electric locomotive. Simpson assumed a diesel engine having a thermal efficiency of 48%; I feel that’s a bit high as the newest Tier 4 engines are ~44% efficient.
To calculate (pencil) the locomotive’s tank-to-rails energy efficiency, you multiply the efficiency of each element, like this:
Diesel engine (@ notch 8 traction power rating): 44% efficient 0.44
Traction alternator and rectifiers: 96% efficient 0.96
DC-to-AC inverters: 99% efficient 0.99
AC traction motors: 96% efficient 0.96
Traction motor gears and bearings: 99% efficient 0.99
OVERALL ENERGY EFFICIENCY: 0.44 X 0.96 X 0.99 X 0.96 X 0.99 = 40% EFFICIENT = 0.40
This means that 40% of the fuel’s chemical energy ultimately reaches the rails as traction work. The missing 60% energy is rejected as waste heat from the radiators and the exhaust stream, electrical heating, bearing friction, etc. (And don’t forget aerodynamic drag, highly variable and not included in Simpson’s calculation.)
Key points to remember:
- The lowest individual energy efficiency of all elements in a system sets the limit for total efficiency. If our diesel engine efficiency drops from 44% to 40%, overall efficiency drops to 36% (do the math).
- The more energy conversion steps involved, the greater the risk that overall energy efficiency will be disappointingly low. If we take Simpson’s locomotive and add, as an example, a speed reducing gear (assumed efficiency = 95%) between the engine and the alternator, the overall locomotive energy efficiency drops from 40% to 38%.
Penciling Alternative Locomotive Energy Efficiency
Let’s look at the energy efficiency of battery-electric, hydrogen fuel cell and straight electric locomotives. For comparison purposes, I am assuming we want each of the alternative locomotives to deliver 1.0 megawatt-hour (MWh) of energy to the rails as traction work (1 MWh = 1,341 horsepower-hours). Pay particular attention to how the individual efficiencies affect total efficiency.
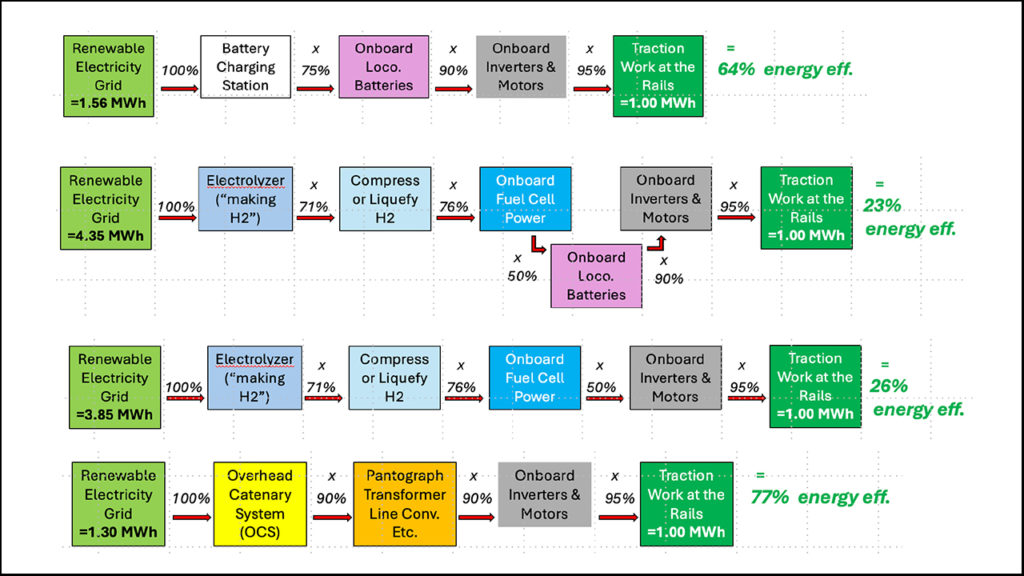
ENERGY CONVERSION DIAGRAMS FOR A BATTERY-ELECTRIC LOCOMOTIVE (FIGURE 3A, TOP), HYDROGEN FUEL CELL + BATTERY LOCOMOTIVE (FIGURE 3B, SECOND FROM TOP), 100% FUEL CELL LOCOMOTIVE (FIGURE 3C, SECOND FROM BOTTOM), AND STRAIGHT-ELECTRIC LOCOMOTIVE (FIGURE 3D, BOTTOM).
A battery-electric locomotive (BEL) has storage batteries holding energy in the form of electrons. Figure 3A is an energy conversion diagram for a BEL, which by calculation will need ~1.56 MWh of energy from the grid to produce 1.00 MWh of work at the rails for an overall 64% energy efficiency (36% energy waste). I’m assuming stationary charging (in-motion charging from overhead catenary could be more efficient depending on the locomotive design).
A hydrogen fuel cell (H2FC) locomotive will also have propulsion batteries, so I’m going to call it a hydrogen fuel cell + battery locomotive (H2FCBL). Again, as shown in Figure 3B, we need ~4.35 MWh of energy from the grid to produce 1.00 MWh of work at the rails for an overall 23% energy efficiency (77% energy waste).
If we eliminate the onboard batteries and equip it as a 100% fuel cell locomotive, energy efficiency goes up slightly to 26% (74% energy waste), as shown in Figure 3C.
The reason for equipping a fuel cell locomotive with propulsion batteries is to reduce the amount of fuel cells by 50%. An H2FCBL locomotive with a total power rating of 4,400 hp (3,282 kilowatts, kW) would require 2,200 equivalent hp of fuel cells and another 2,200 equivalent hp of fully charged batteries. When (not if) the propulsion batteries become depleted, the fuel cells may still be cranking out maximum power for traction, but you end up with a “half-power locomotive.”
The electrolyzer is a device that uses electrical energy to break apart molecules of water (H2O) to create hydrogen (H2). The best electrolyzers are around 71% efficient, so 29% of the electrical input energy is wasted as heat. Because the gaseous hydrogen must be made transportable onboard the locomotive or a hydrogen energy tender, you must compress or liquefy gaseous hydrogen, and the average efficiency of those processes is 76%. We’ll ignore the inevitable leaks of microscopic hydrogen molecules (more inefficiency) through piping gaskets, valves, etc.
Onboard the locomotive, the hydrogen goes into the fuel cell, combines with oxygen from the air and electrons are released as an electrical current at an efficiency of (at best) 50% (since the oft-quoted 60% fuel cell efficiency is only at low power, not at high power, which is typical for operating a locomotive).
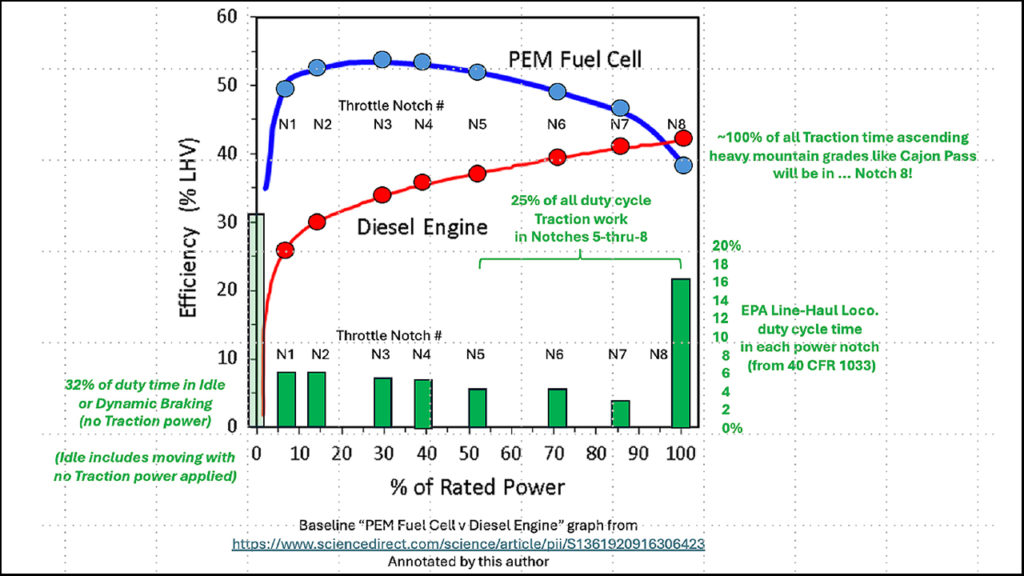
Note, I’m using a fuel cell efficiency of 50%, not the more claimed 60%. Why is 50% a more realistic efficiency for a line-haul locomotive fuel cell? Because fuel cell efficiency peaks at low power and then drops as power increases to maximum. A diesel engine is the opposite: Efficiency starts low and peaks at high power, as shown in Figure 4.
Again, I lose another 10% of the energy into and out of the propulsion battery, and finally produce traction work at the rails. But the work done (1.00 MWh) is only 23% of the 4.35 MWh of electrical energy supplied “into the system” at the beginning.
Bottom line, a fuel cell locomotive producing 1.00 MWh of work at the rails will consume between 3.85 and 4.35 MWh of grid energy. Given the talk about our nation needing to invest $1 trillion in new electricity generation and transmission infrastructure, do these numbers pencil for a high-density freight corridor?
Last, let’s look at a straight-electric locomotive, Figure 3D. We take energy from the grid, feed it into the catenary, reduce the voltage, create controlled-frequency AC for the motors and make tractive effort. One MWh of work at the rails requires 1.30 MWh of grid energy, for an overall 77% energy efficiency (23% energy waste):
Other people have penciled these numbers. Reinhard Christeller, a senior rolling stock and business consultant in the European Union, recently published the same analysis with similar results.
There are no “silver bullet” solutions. In simple terms, a hydrogen fuel cell locomotive (assuming it has a hydrogen energy storage tender) can operate over a longer distance than a battery-electric locomotive. But the H2FCBL locomotive uses 179% more grid energy (4.35 vs. 1.56 MWh) than the battery locomotive. This is but one example of the complicated analyses and decisions that await all of us as we explore the new world of freight railroad energy and propulsion.
If you fail to properly pencil your numbers, you could end up going where one of my favorite forecasters of the future, the late Yankee ballplayer Yogi Berra, envisioned: “If you don’t know where you are going, you might end up someplace else.” Pencil your energy efficiencies!