Discovering, Predicting, Resolving Track Defects
Written by David C. Lester, Engineering Editor and Editor-in-Chief, Railway Track & Structures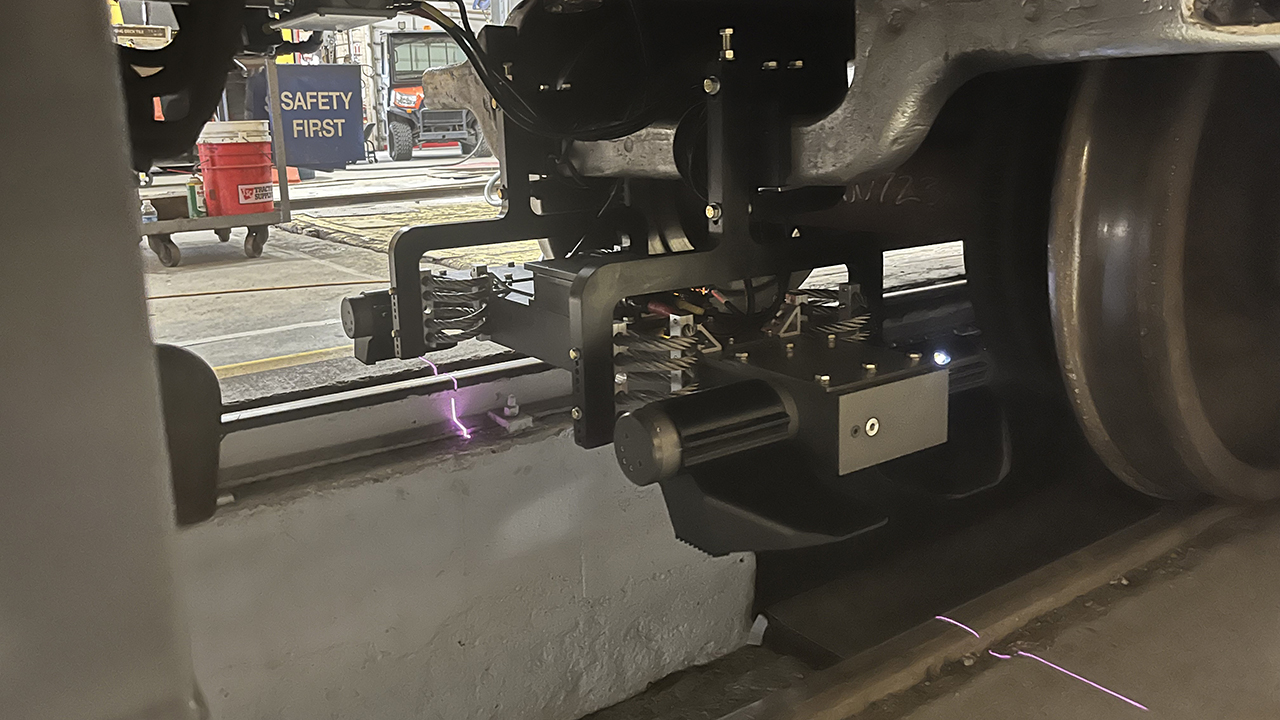
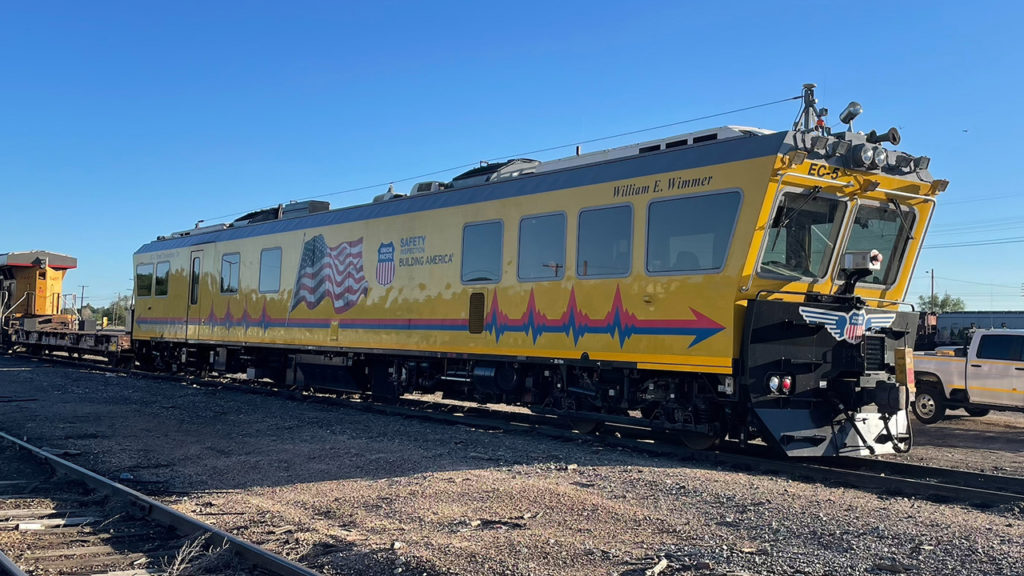
ATGMS System in Fox River shows the laser being emitted from the system to measure track. Union Pacific photo.
RAILWAY AGE, AUGUST 2024 ISSUE: How Union Pacific leverages state-of-the-art inspection technology.
With more than 32,000 miles of track covering 23 states in the western two-thirds of the U.S., those charged with inspecting and maintaining track at Union Pacific (UP) have their work cut out for them.
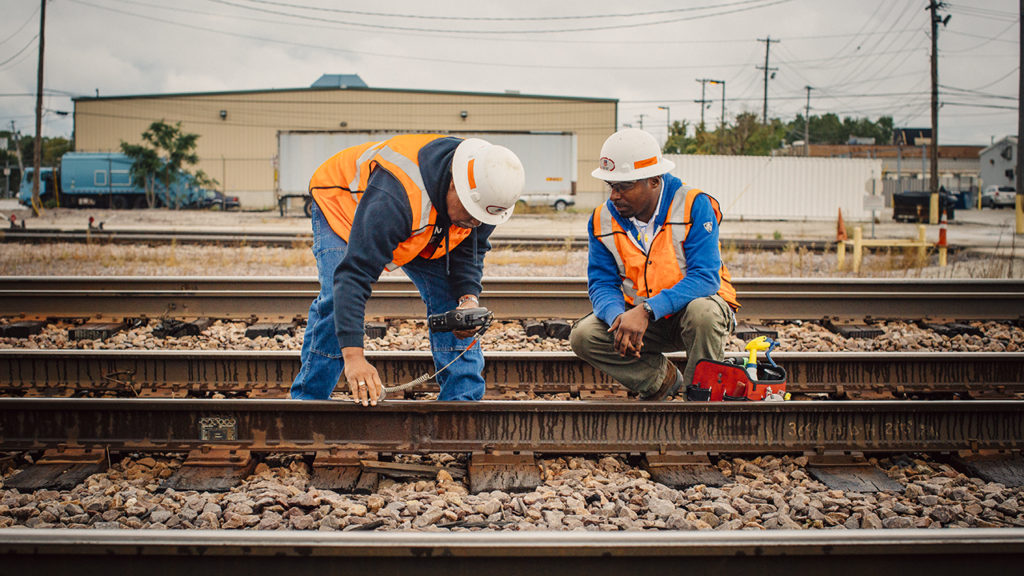
From maintaining track geometry to discovering existing or potential rail defects, the team is inspecting some part of the railroad 24/7 with visual inspection, rail-bound vehicles (geometry cars), Hi-Rail vehicles or autonomously with locomotive- or boxcar-mounted vehicles. The arrival of autonomous inspection is perhaps the most exciting because track folks can rest a little easier, knowing numerous vehicles all over the railroad are inspecting constantly and relaying track condition information back to headquarters.
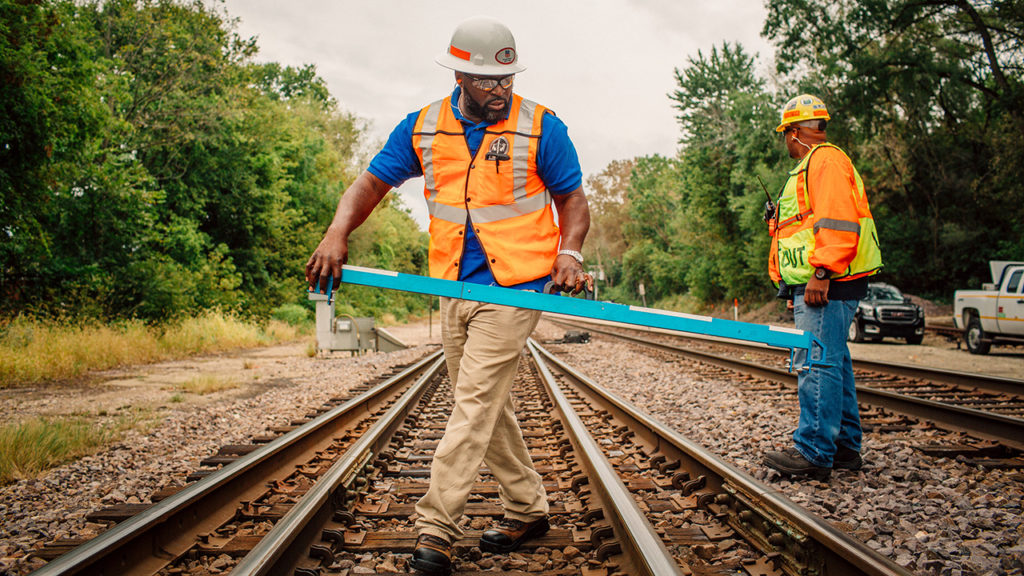
Stephen Ashmore, AVP of Engineering Infrastructure, says, “We’ve seen a major shift in how we gather data about rail wear and determining when it should be replaced. Curves are a good example. Before the advent of new technology, we would have crews out on the rail, or ‘boots on the ground,’ if you will, making quality measurements but there was a little subjectivity in the measurements. In addition, having people on the ground around the railroad is a safety issue (potential risk of slips, trips and falls), so that is greatly improved by people on equipment. With the new technology, Union Pacific’s work is now more data driven as we gather a tremendous amount of data and leverage it through analytics, helping us generate more precise predictions around when rail should be replaced. These tools have allowed us to be very effective with the railroad’s capital spend.”
Drew Bokenkamp, AVP of Engineering, says, “Maintenance and track and bridge teams complete our major track renewal programs. We’ve got this massive infrastructure, and I always tell people we’ve got the best team in the business.” Bokenkamp adds that “it used to take us a long time to get across the railroad to get measurements but now with new technology, we can get measurements faster and make more real-time replacement decisions.” This has changed dramatically in the past few years. It used to be that track folks would have to go out and measure every little point on the curve, which took a long time. Now that they no longer must do that, they’re available to do other things that are more useful. Ashmore points out that UP generates its machine learning and other replacement algorithms in-house, while it relies on partners for others and uses some developed by the Federal Railroad Administration (FRA).
UP grinds about 20,000 miles of rail per year, and when planning the annual program, engineers look at data gathered from crewed and uncrewed vehicles, some visual inspection, and replacement history of the rail. In addition, the railroad uses data to configure its lubrication program so it can be very surgical around how much lubrication is used and where that lubrication is placed, both at top-of-rail and gage face.
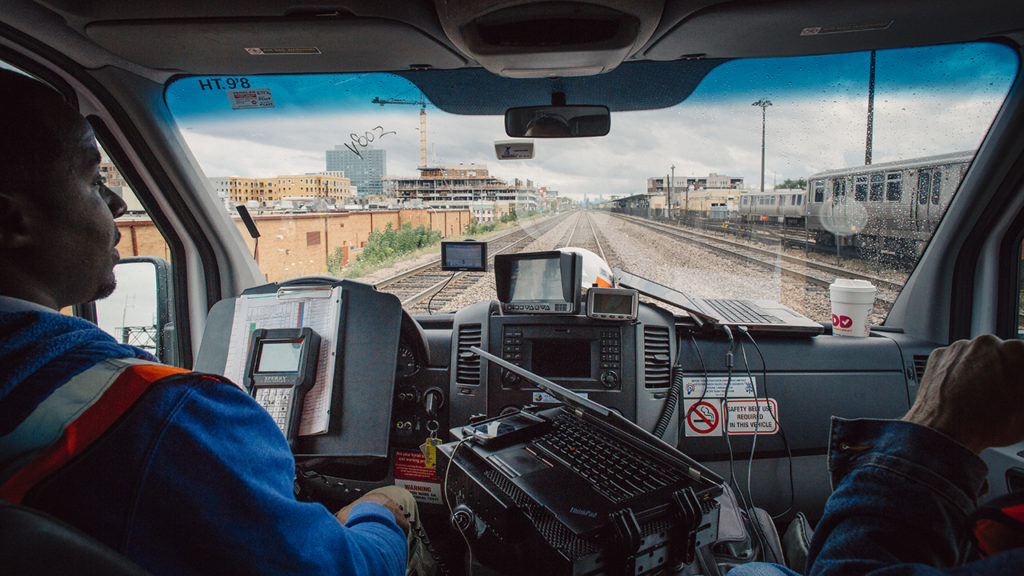
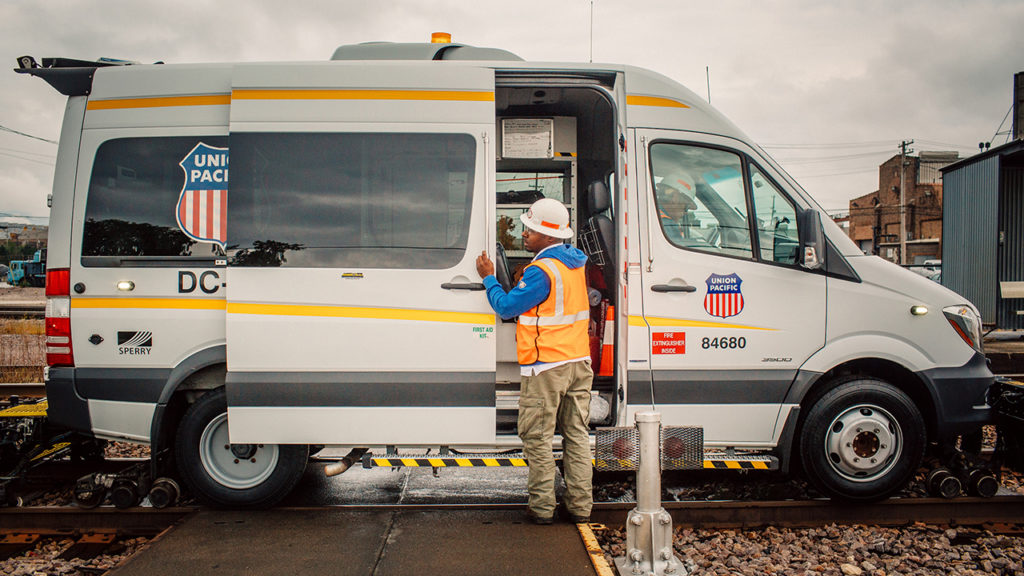
The railroad uses several types of vehicles for track inspection. A crewed Hi-Rail system, one crewed traditional track geometry car, ten automated locomotive systems and three boxcar systems. Most inspection miles are completed by locomotives and boxcars. Locomotives are especially effective because their weight puts the rail under additional strain for more accurate data collection. Since UP began its automated track inspection program, approximately five years ago, defects are down 85%. It’s important to note that when a railroad begins an automated inspection program, it will likely have an uptick in defects simply because more equipment is out on the road looking for them. After a cycle where the entire railroad has been covered at least once, the number of defects drops precipitously. This data can also be used for predictive purposes. Ashmore says, “If you run vehicles over the track frequently, you can get enough data to predict almost to the day when a section of rail needs to be replaced.”
A couple of years ago, UP did a pilot program with a waiver to determine how the data quality from visual inspections compares with the quality of automated inspections and it found that the more runs it makes with the automated equipment the more it learns about how to solve problems. “We used to view the rail-bound geometry car as coming to your territory once per year to inspect and provide a report card on how you’ve been doing with visual inspections. Now, it’s become more of a tool to help us find defects. This is one reason our number of defects has dropped so much during the past few years,” says Bokenkamp.
UP reports that it is not using ground-penetrating radar on any large scale. Ashmore says, “we use it in spot applications where we are trying to get more information about what’s going on if, say, we have a spot in the roadbed that takes longer to dry after a rainstorm than areas around it. However, the data can be a bit unreliable and challenging to work with, so we don’t use it as often.”
While lasers have been an effective tool for a variety of applications over the years, they are used in LIDAR (light detection and ranging) applications quite a bit today. This technology creates a visual image or map of about any perspective (i.e., rocks and vegetation along with railroad) by firing a laser at an object and then seeing how long it takes for the object to reflect the light back to where it was generated. Ashmore says, “this technology gives us a tremendous amount of data and we use the data for vegetation assessment, rock fall assessment, rail wear inspections, and ballast inspections.”
For rail flaw detection, UP relies on ultrasonic detection, which looks for anomalies that could lead to a rail break. The data is gathered by either a rail-bound geometry car or a Hi-Rail vehicle, then analyzed. If the data shows areas of concern, they will be addressed by the track maintenance department.
Drones have come into use over the past several years, says Bokenkamp, and they are being used for several tasks. “Drones are used for bridge inspections, spot applications, site assessments, rock fall risk areas. The also help us build project plans, and fly over safety sensitive or potentially risky areas, with some of these applications still part of a pilot program.” Drones are particularly helpful for assessing situations after major storms. UP can take the visual data provided by the drone and determine what materials it will need to make repairs. “We can use drones to look at certain locations we can’t get to because of an obstacle (i.e., fallen rocks and trees) after storms,” says Bokenkamp.
Bokenkamp adds that “regarding storm events, we plan for those. We know they’re coming and place materials and tie things down before the storm arrives. Storm recovery is a quicker than ten years ago because of new large-scale efforts, such as shipping materials by train to get it right to where it’s needed. If we find water over the rail, we document those locations and strengthen that infrastructure to prevent the same thing from happening in the event of another storm. We also do a lot of brush cutting using helicopters, particularly in the south, to reduce the likelihood of fallen trees and vegetation blocking the railroad.”
Thermal misalignments, often referred to as sun kinks, are a problem for every railroad, but after gathering data and doing research in a crewed geometry car or Hi-Rail vehicle, the railroad knows specific kinds of days and locations where there’s potential for a misalignment. This is another example of getting lots of data, especially for curves, to see where a misalignment might be a possibility. Once the railroad identifies such a location, a team goes to the location for visual analysis and testing afterward. “We’re always trying to get the right rail neutral temperature and changing weather conditions make it difficult,” says Bokenkamp. “Multiple factors can contribute to a thermal misalignment, so we must leverage all the data changes we find. However, the best line of defense is visual inspection and research is pointing toward autonomous inspection and how we can identify potential thermal misalignments via data.”
Bokenkamp adds that the plethora of new tools and industry-changing technology helps a great deal with personal safety. Instead of having “boots on the ground,” most of the people on track installation and maintenance teams are aboard some types of machinery. In addition, this new technology has helped UP reduce derailments by 28% during the past ten years and by 30% during the past year. Bokenhamp also says, “The main points around this new technology are that data has helped us put tools and resources in the right place, and we’ve improved overall safety.”
Ashmore concludes by saying, “The entire industry has worked on pushing this technology. I’m very proud what we’re doing at Union Pacific and of the industry’s ability to come together and adopt these changes.”


